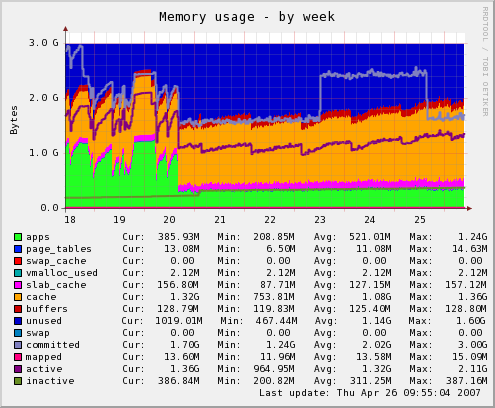
One of the default plugins is memory use. In this graph you can see the memory usage for one of our application servers. Last week we changed some configuration so the application won't grow to eat a ton of memory every few hours.
Other similar tools are Cacti and Ganglia. I've played with both but they didn't hook me like Munin did. I never really liked how Cacti and Ganglia is put together, but the sensibilities of Munin are ones that makes a great tool.
The basic Munin configuration is extremely short and simple; in particular on the monitored nodes.
Everything is driven by "plugins" - again very simple and self-contained. The plugins "self-configure", for example giving the list of mount names for the disk usage graphs so there's no configuration. That way most of the plugins don't need configuration, making it's easy to just duplicate the configuration to all your nodes.
It's flexible, just in the right spots. And when you do need a configuration override for a plugin it's easy to do. The configuration system even fits well the puppet configuration tool - another favorite.
We run multiple MySQL instances on several of our database servers and the existing MySQL plugins don't handle that, but since all the plugins are shell or Perl scripts, it will be easy to fix.

The only thing I don't like about Munin is it wants an agent on every system it monitors. I do not like that. I don't understand why most monitoring systems go this route. In the age of SSH, just creating an account for the monitoring system and throwing a key into its .ssh/authorized_keys file is all I ever want to alter on a system I need to monitor. I'm currently using Nagios and I've written a custom plugin for everything. The plugins all basically do something like "ssh remotemachine df -h" and then process the result. If there's a need for running an agent, I can't think of it.
You can of course write a "proxy" plugin that uses ssh in the same way for munin too.
Nicolai
I am sorry to say that if you are using ssh you are still using an agent. The start-up overhead of the sshd user processes are going to way higher than just running the agent.
The graph is nice, but it would be better if there was documentation to go with it. Why are there both lines and bars and which are which and what do they all mean. For example, all that blue at the top of the chart, I suspect, represents "unused", though I can't really tell the difference between that shade of blue and the blue for page tables. So I'm calling "unused" a bar, as in bar chart, in that it stacks on top of other stuff. But then there's this line, which looks to me to be the "buffers" color, that cuts through the "cached" bar. So what does that mean? Why is that a line and not a bar, or if it is a bar, why is "cached" both above it and below it?
Now I'm not really expecting Bjørn to answer this, but while I've found plenty of documentation on the Munin system, I can't find any that answers these kinds of questions about the plugins that do all the real work. We need documentation!
Not only is the overhead less on an agent installed on each system, but there is potential for better security (unless, of course, you're willing to take the time to write a custom shell for that account which restricts it to performing the work the monitor needs it to perform - which you obviously are not, as that involves installing an agent of another sort on each system.)
I currently use Nagios; my systems run custom agents to do the actual data acquisition. Nagios simply connects to the appropriate ports and downloads the data. Those agents do not fork per connection, and none of them exec anything. They don't read any data from Nagios, so are not vulnerable to a hostile system spoofing the IP, breaking the SSH encryption, and overflowing their buffers. Those which do not convey security-sensitive data don't even bother with encryption overhead (although they still restrict access to the various monitoring servers.)
As an added advantage (at least for paranoid, highly redundant, or dysfunctional organizations), this setup allows multiple monitoring servers without significant impact. (When I started working for a prior organization, there were around 15 different groups running monitors on the server I was hired to run. Setting up something similar there and convincing all of those groups to change to monitoring the new probe points resulted in a measurable performance improvement.)
@Xaprb: that's why I wrote pmmn a while ago. I also wrote an simple article[1] about how to use it.
[1] http://blog.pwkf.org/post/2008/11/04/A-Poor-Man-s-Munin-Node-to-Monitor-Hostile-UNIX-Servers