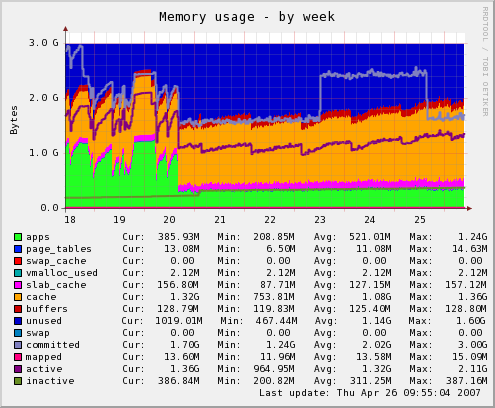
One of the default plugins is memory use. In this graph you can see the memory usage for one of our application servers. Last week we changed some configuration so the application won't grow to eat a ton of memory every few hours.
Other similar tools are Cacti and Ganglia. I've played with both but they didn't hook me like Munin did. I never really liked how Cacti and Ganglia is put together, but the sensibilities of Munin are ones that makes a great tool.
The basic Munin configuration is extremely short and simple; in particular on the monitored nodes.
Everything is driven by "plugins" - again very simple and self-contained. The plugins "self-configure", for example giving the list of mount names for the disk usage graphs so there's no configuration. That way most of the plugins don't need configuration, making it's easy to just duplicate the configuration to all your nodes.
It's flexible, just in the right spots. And when you do need a configuration override for a plugin it's easy to do. The configuration system even fits well the puppet configuration tool - another favorite.
We run multiple MySQL instances on several of our database servers and the existing MySQL plugins don't handle that, but since all the plugins are shell or Perl scripts, it will be easy to fix.